
Want to keep track of your sales status at all times? By keeping your iCHEF POS connected to the internet, you can access real-time sales data summaries on both the App and the Backend. You can go to specific locations to view the data according to your needs.
| Type | Calculation Period | Data Content | Viewing Location |
|---|---|---|---|
| Shift Sales | The sales amount statistics from the Last Shift Closing Time ~ Current Time | Outstanding Amount, Paid Amount | POS > Toolbox > Current Sales |
| Daily Sales | The order amount statistics from 00:00 ~ 23:59 on the current day | Outstanding Amount, Paid Amount | Backend > Home |
| Daily Revenue Analysis | The paid order amount statistics from 00:00 ~ 23:59 on the current day | Comparison of change with past values, Sales Ranking | Backend > Sales & Reports > Current Status |
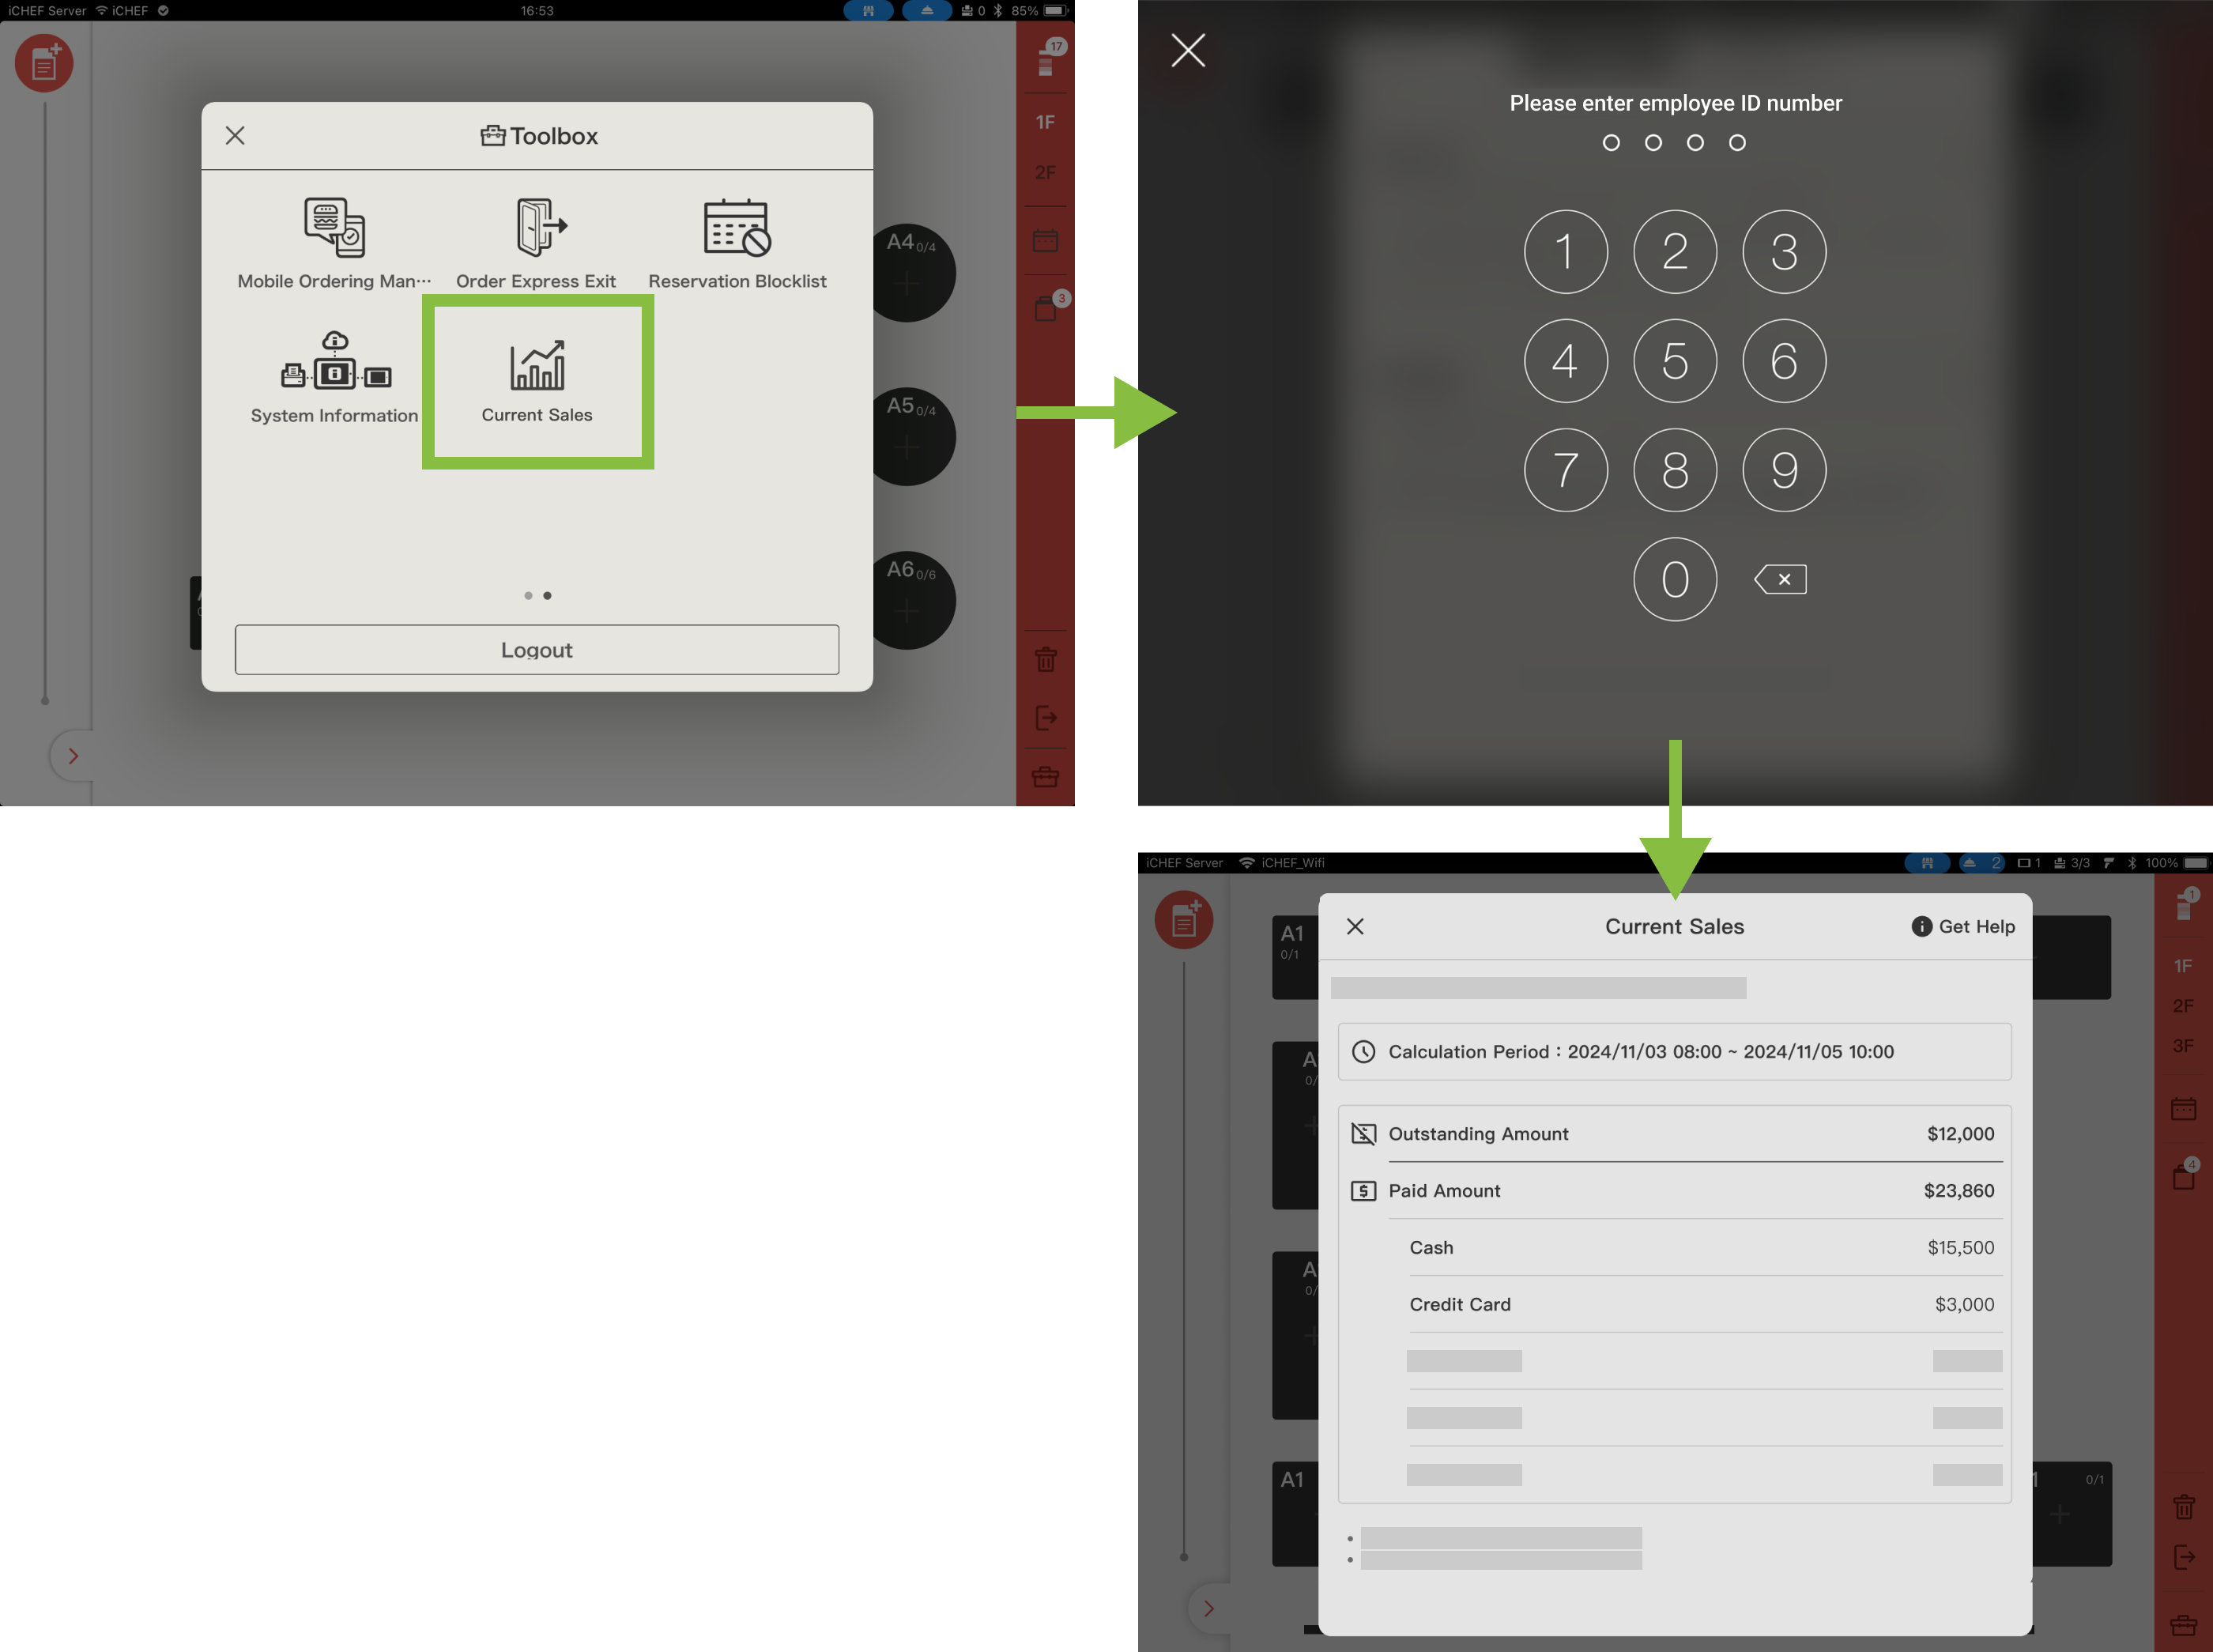
Shift Sales (POS)
➤ iCHEF POS App: Toolbox > Current Sales
The Current Sales in POS includes Paid and Outstanding amounts, allowing on-site staff to keep track of the sales performance during the shift.
To ensure greater security for the sales data, permission verification is required to enter this page. By default, only the Administrator (Admin account) can view it. The Administrator can adjust permissions in the Backend to designate specific personnel (e.g., Store Manager) to view this page.
Calculation Method
- Calculation Period: Sales amount statistics from the Last Shift Closing Time ~ Current Time
- Data Content (Includes service fees, discounts, and allowances):
- Outstanding Amount:
- Dine-in: Orders where the “Open Time” is within the Calculation Period.
- Takeout: Orders where the “Estimated Pickup” is within the Calculation Period.
- Paid Amount:
- Orders across the entire store where the “Checkout Time” is within the Calculation Period.
- Outstanding Amount:
- Update Method: Sales amount is recalculated after each shift closing. The data updates upon re-entering the page.
Note when using multiple iPads in the store:
・ If the entire store shares the same Sales Book, this page can only be viewed from the Cashier iPad (Main Device).
・ If each iPad uses a separate Sales Book, the “Paid Amount” will only show the amount for the Sales Book assigned to that specific iPad.
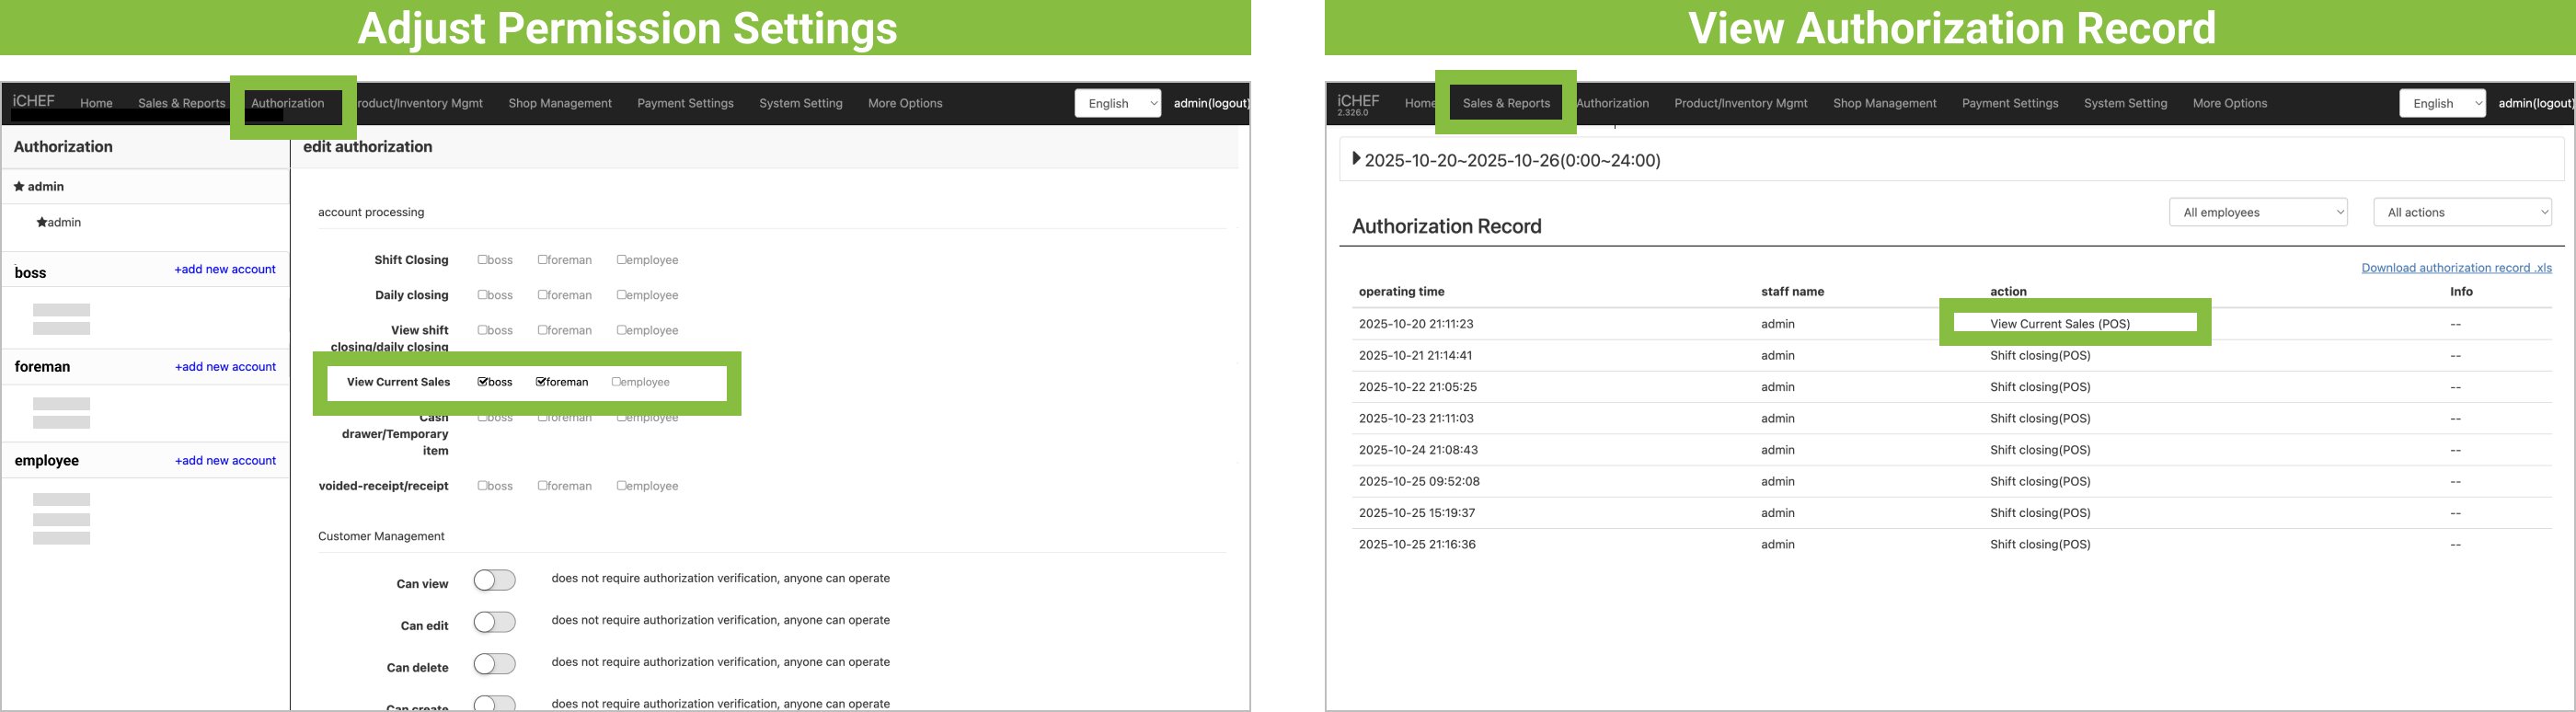
- Adjust Authorization Settings: The Administrator can adjust authorization at any time via Backend > Authorization > Accounting Processing by checking the “View Current Sales” option for the account groups they wish to grant authorization to.
- View Authorization Record:Backend > Sales & Reports > Authorization Record
FAQs
This is because the Calculation Period for Current Sales in the POS is from “Last Shift Closing Time ~ Current Time.” Taking a dine-in order as an example, it will only be included if its “Open Time” is within the Calculation Period.
- Scenario: When a dine-in order is opened before the shift closing but not paid after the shift closing, the order amount will not be counted within the Calculation Period.
- Example (Assuming only one order):
- Order A1 is opened at 09:00, the order amount is $100, and the status is Outstanding.
➜ When checking at 10:00, the Outstanding Amount is “$100.”- The Calculation Period is from 00:00 (assumed last shift closing time) ~ 10:00 (current time).
- Order A1’s Open Time is 09:00 = Included in the Calculation Period.
- Shift closing is performed at 11:00. Order A1 is still not finished, and the status remains Outstanding.
➜ When checking at 12:00, the Outstanding Amount is “$0.”- The Calculation Period is from 11:01 (last shift closing time) ~ 12:00 (current time).
- Order A1’s Open Time is 09:00 = Not Included in the Calculation Period.
- Order A1 is opened at 09:00, the order amount is $100, and the status is Outstanding.
- When will the amount for Order A1 be counted?
- Once Order A1 is paid for, this order amount will be included in the Paid Amount.
Since the Calculation Period for Current Sales in the POS is from “Last Shift Closing Time ~ Current Time,” and Sub-iPads can perform shift closings independently when multiple iPads are used for checkout in the store.
- Scenario: When the Last Shift Closing Time of the Cashier iPad and the Sub-iPad are different, the orders counted will also be different.
- Example:
- In-store orders:
- Order A1, opened at 09:00, order amount is $100.
- Order A2, opened at 10:00, order amount is $60.
- Order A3, opened at 11:00, order amount is $40.
- ➜ Current time is 11:30, all three orders are Outstanding.
- Viewing Current Sales:
- Cashier iPad: Last shift closing was at 09:30. When viewing at 11:30, the Outstanding Amount is “$100.”
- Calculation Period is from 09:31 (last shift closing time) ~ 11:30 (current time).
- Orders within this period:
- Order A2, opened at 10:00, amount is $60.
- Order A3, opened at 11:00, amount is $40.
- Sub-iPad: Last shift closing was at 10:30. When viewing at 11:30, the Outstanding Amount is “$40.”
- Calculation Period is from 10:31 (last shift closing time) ~ 11:30 (current time).
- Orders within this period:
- Order A3, opened at 11:00, amount is $40.
- Cashier iPad: Last shift closing was at 09:30. When viewing at 11:30, the Outstanding Amount is “$100.”
- In-store orders:
Daily Sales (Backend)
➤ Backend: Home
Displays the Paid and Outstanding amounts for the current day, allowing you to quickly estimate current revenue even when you are not in the store.

Calculation Method
- Data Period: Statistics of the order amounts (including service fees, discounts, and allowances) created from 00:00 ~ 23:59 on the current day.
- Data Content: Outstanding Amount, Paid Amount
- Update Method: Data is automatically updated every 10 minutes. Keep the iPad connected to the internet, and refresh the home page to see the latest data.
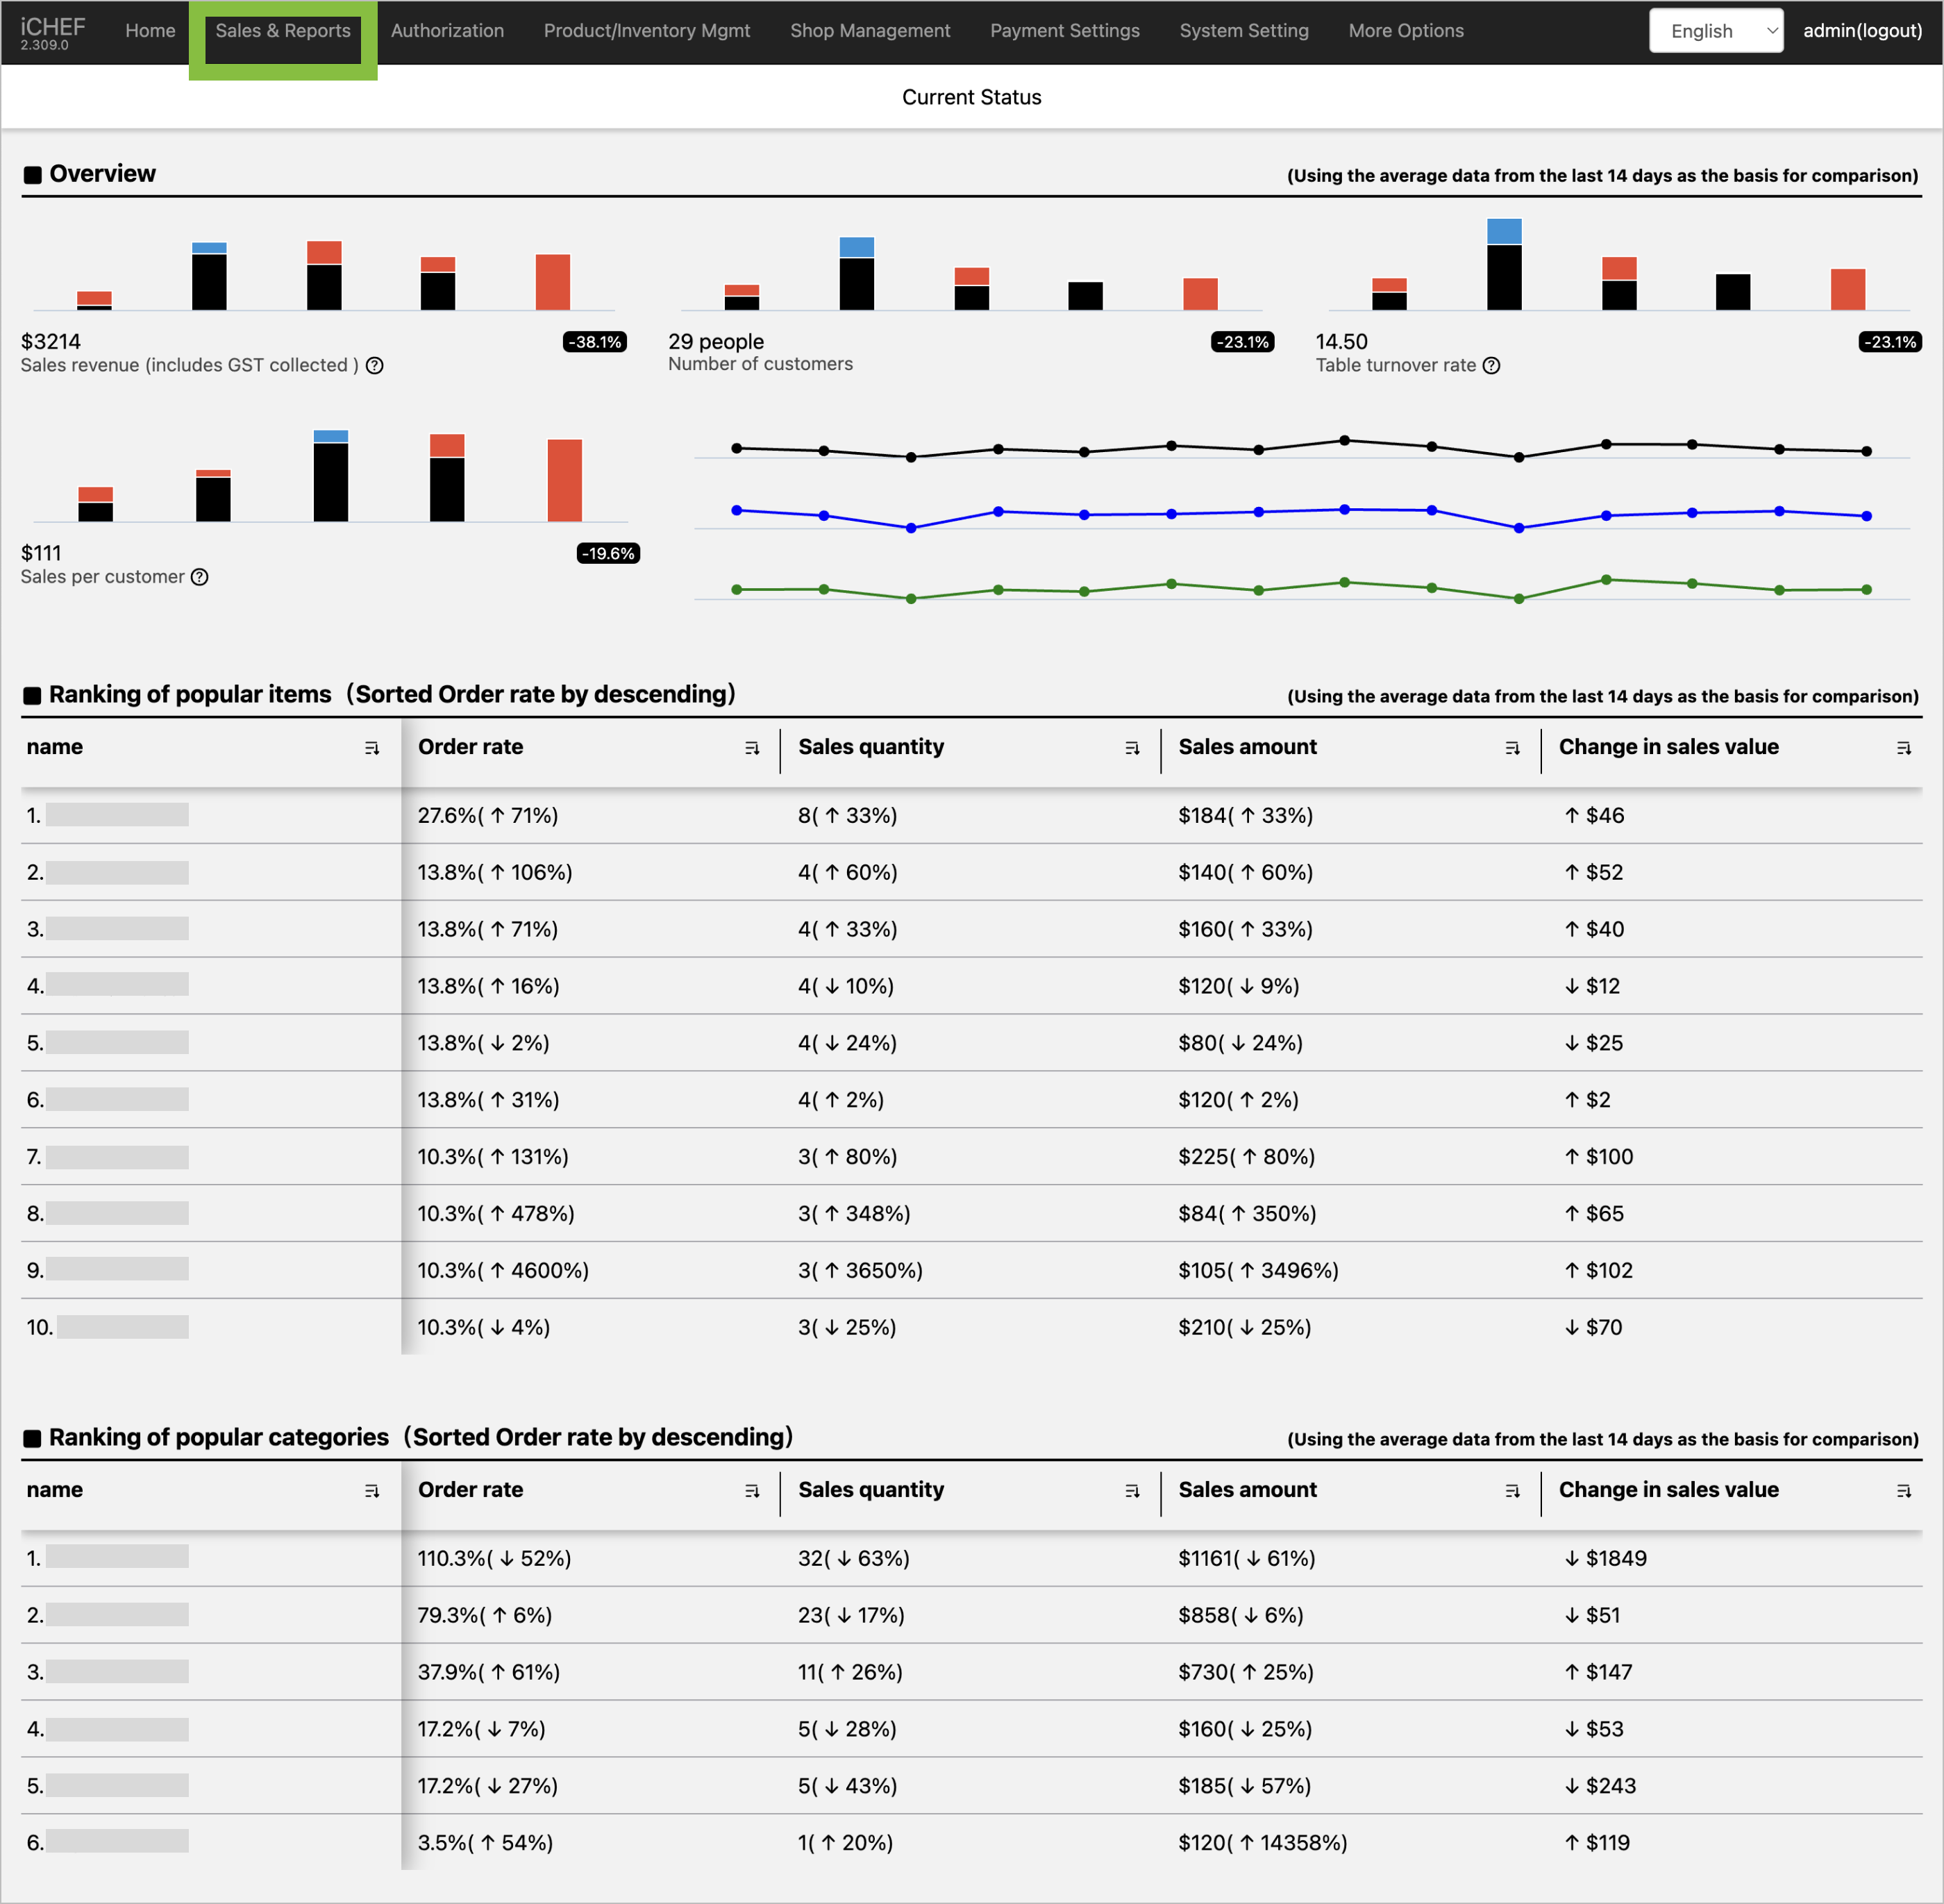
Daily Sales Analysis (Backend)
➤ Backend Location:Sales & Reports > Current Status
This further summarizes and analyzes the revenue data for paid orders on the current day. By comparing it with past values, you can observe changes and differences.
Calculation Method
- Data Period: Statistics of the amounts (including service fees, discounts, and allowances) for orders that have been completed and paid from 00:00 ~ 23:59 on the current day.
- Past Data Comparison Method: The system will automatically use the average data from the past 14 days as the baseline for comparison.
Data Content Description
Bar Chart
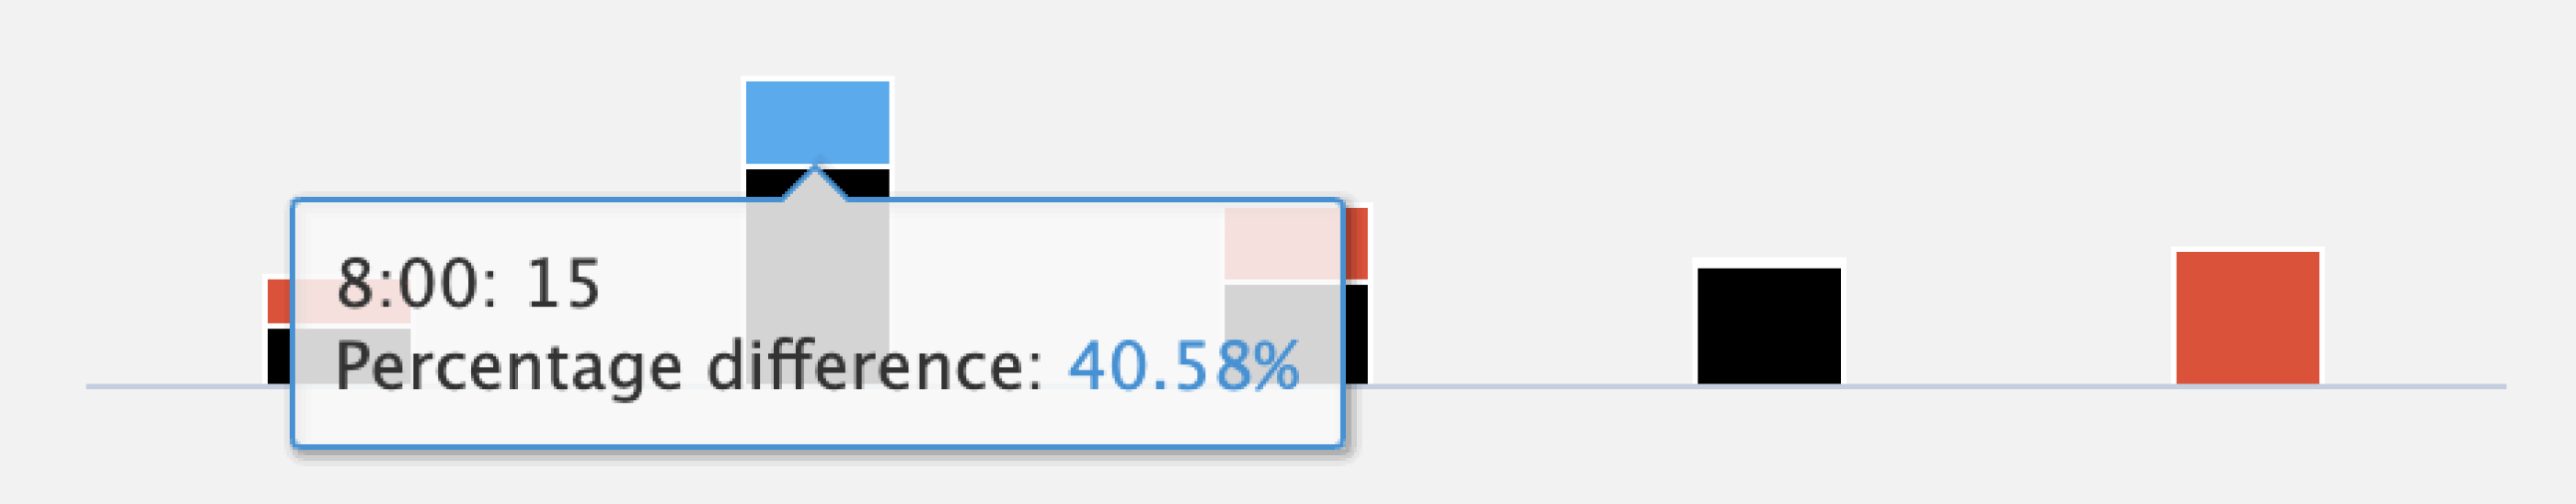
Through the bar chart, you can observe the trends of each item, and different colors in the bar chart are used for comparison with past data.
- Black: [Repeated] values compared to the base period average.
- Blue: [Increased] values compared to the base period average.
- Red: [Decreased] values compared to the base period average.
- Gap Percentage: Displays the percentage of decrease or increase compared to the base period average.
Line Chart

Through the line chart, you can observe the daily changes in Sales revenue, Number of customers, and Sales per customer.
- Black: Displays the line chart change for [Sales revenue] within the time range.
- Blue: Displays the line chart change for [Number of customers] within the time range.
- Green: Displays the line chart change for [Sales per customer] within the time range.
Operating Net Revenue
- Field Description: After order completion and payment, the payment amounts are summed (excluding voids).
- Calculation Formula: None
- Additional Info: None
Number of customers
- Field Description: Sum of customer counts within orders after orders are completed (deducting voided counts).
- Calculation Formula: None
- Additional Info: None
Table turnover rat
- Field Description: How many times the in-store seats have served customers.
- Calculation Formula: Number of customers / Total seats
- Additional Info: For more operational instructions, please go to [Table Settings].
When querying [Table turnover rate], please only select [Dine In] in the advanced fields of the order filter.
Sales per customer
- Field Description: Average consumption amount per customer.
- Calculation Formula: Sales revenue / Number of customers
- Additional Info: None
Only items sold on the current business day will be displayed, and sorted by the item’s [Order rate].
Item Name
- Field Description: The name of the sold item.
- Calculation Formula: None
- Additional Info: Adjusting the name will only affect the display of the name in the report; the values within the report will not be affected. For more operational instructions, please go to [Manage Items].
Growth Rate
Growth Rate will be displayed within parentheses in the report data, presented as a percentage.

- Field Description: Displays the growth ratio when comparing the current value with the past base period value.
- Calculation Formula: (Current Value / Past Base Period Value) / Past Base Period Value x 100 %
- Additional Info: None
The growth rate of item sales may exceed 100%, mainly because each customer may order the same item more than 2 times. If the growth rate shows ∞, it means there is no comparative data within the corresponding time period, or the comparative data is too small to calculate.
Order rate
- Field Description: The proportion of an item’s sales among all customer counts.
- Calculation Formula: Sales quantity / Number of customers
- Additional Info: None
Sales quantity
- Field Description: The sum of each item within orders after orders are completed (deducting voided quantities).
- Calculation Formula: None
- Additional Info: None
Sales amount
- Field Description: The sum of actual item sales amounts after orders are completed (deducting voided amounts).
- Calculation Formula: None
- Additional Info: None
Change in sales value
- Field Description: The change in an item’s sales amount within the specified time range.
- Calculation Formula: Current Average Sales Amount – Past Base Period Average Sales Amount
- Additional Info: None
A [negative value] for item sales indicates that orders were voided during the period. Since the quantity of voided items is deducted from the current period, a negative value will be displayed if the current period’s item sales quantity is less than the quantity of voided items.
The calculation method for [Ranking of popular categories] is the same as for items, with the main difference being that the data will sum up information for items within the category, to help merchants understand consumer preferences for the restaurant.
Product Category Name
- Field Description: The category name set in item management.
- Calculation Formula: None
- Additional Info: Adjusting the name will only affect the display of the name in the report; the values within the report will not be affected. For more operational instructions, please go to [Manage Items].
Growth Rate
Growth Rate will be displayed within parentheses in the report data, presented as a percentage.
- Field Description: Displays the growth ratio when comparing the current value with the past base period value.
- Calculation Formula: (Current Value / Past Base Period Value) / Past Base Period Value x 100 %
- Additional Info: None
The growth rate of item sales may exceed 100%, mainly because each customer may order the same item more than 2 times. If the growth rate shows ∞, it means there is no comparative data within the corresponding time period, or the comparative data is too small to calculate.
Order rate
- Field Description: The proportion of an item’s sales among all customer counts.
- Calculation Formula: Sales quantity / Number of customers
- Additional Info: None
Sales quantity
- Field Description: The sum of each item within orders after orders are completed (deducting voided quantities).
- Calculation Formula: None
- Additional Info: None
Sales amount
- Field Description: The sum of actual item sales amounts after orders are completed (deducting voided amounts).
- Calculation Formula: None
- Additional Info: None
Change in sales value
- Field Description: The change in an item’s sales amount within the specified time range.
- Calculation Formula: Current Average Sales Amount – Past Base Period Average Sales Amount
- Additional Info: None